Stats blocks
KPIs with trends, chart cards and usage meters: the figures at the top of a dashboard or a settings page, as cells for your grid. 4 variants, 4 free.



About these stats blocks
KPIs with trends, chart cards and usage meters: the figures at the top of a dashboard or a settings page, as cells for your grid. All 4 are single React files built on shadcn/ui components. They use only your theme tokens, so they take your colors, radius and fonts, and they work in Next.js, Vite, React Router, TanStack Start and Astro.
Free and Pro
4 of them are free and MIT licensed. Every one, Pro included, has a live preview.
Which one to pick
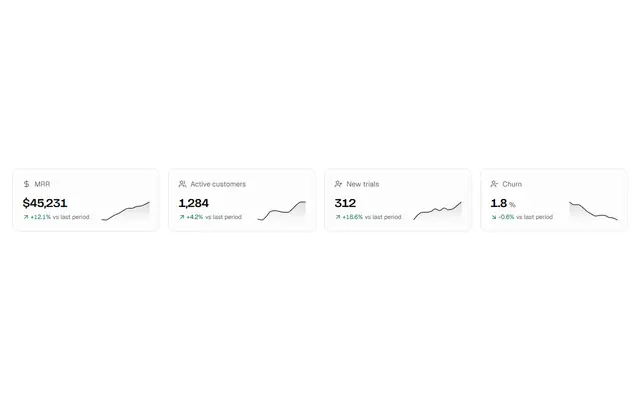
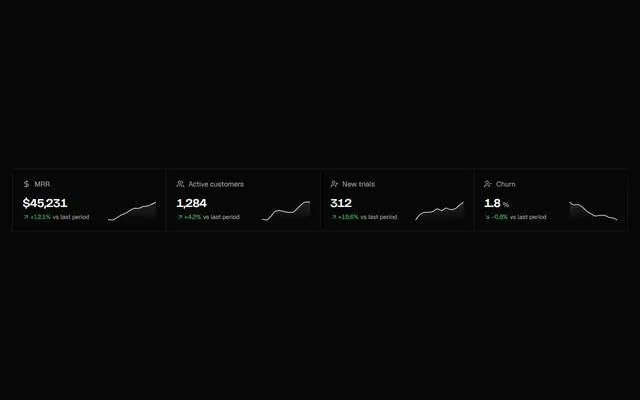
- KPIs with trends (free): Four figures with their change and a sparkline, in one group of cells that wraps from one to four columns.
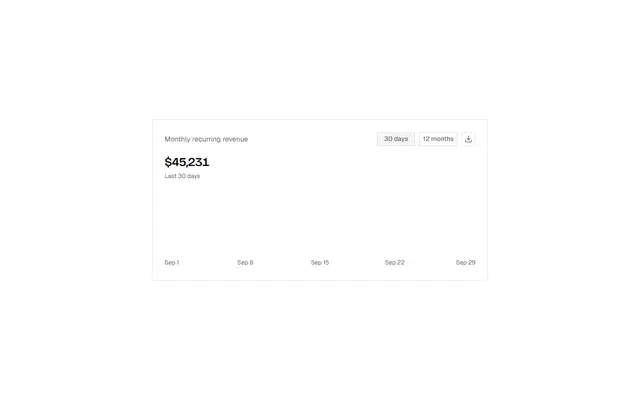
- Chart card (free): One figure and its curve over time, with a period switch and an export button.
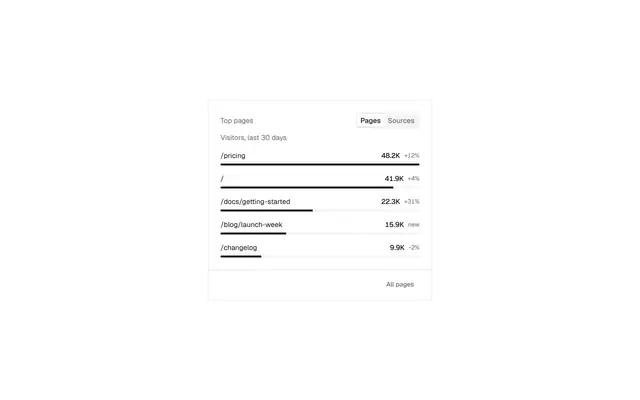
- Top ranking (free): The top pages or sources with their figures, a bar per row relative to the first, and a switch between the two rankings.
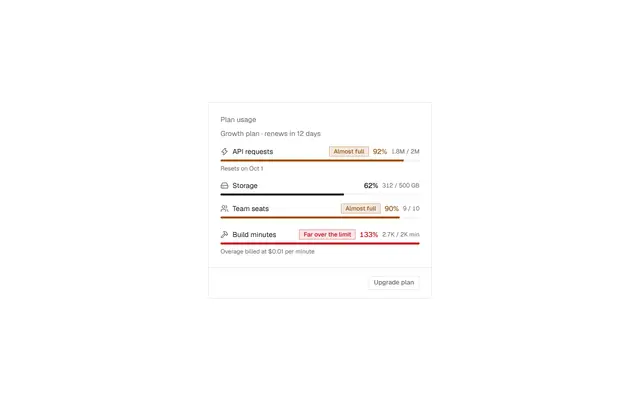
- Usage meter (free): Each plan limit with what is used of it: bars that turn amber near the limit and red over it, a note per metric and an upgrade button.
Building a whole page? See every block for dashboards, assembled the way they fit together.